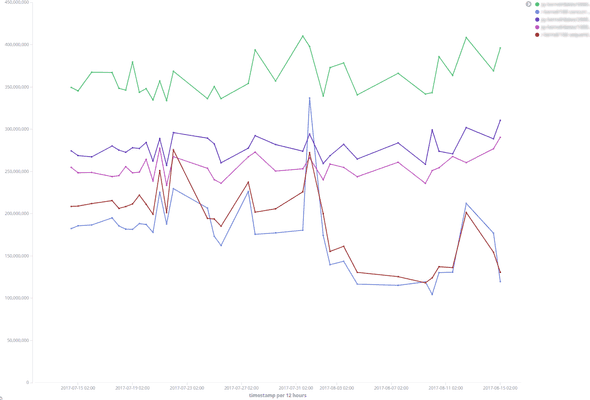
In this post I’ll show you how to see the performance of your software project improve over the entire lifetime of the project. That is, how to get something like the below picture. For that, you’ll need to systematically track and store benchmark results over time. We’ll use Elasticsearch for that.
Here’s a standard workflow:
- Your manager tells you clients have been complaining about the performance of frobnicating aadvarks. Your manager wants you to solve that.
- You quickly put together a few benchmarks that characterize the cost of frobnication.
- You then spend the next few days or weeks playing the game: look at benchmark numbers, make a change, rerun benchmarks, compare, commit if the numbers look better. Rinse and repeat.
What’s missing is the notion of time. How do you know that as you work on the product for the next few months, you aren’t introducing any performance regressions? Better still, how do you visualize what progress has been made over the last few months (or years!), when clients were already complaining about performance and you had already made some improvements?
Tracking performance over time is hard. For one, results need to be stored in a shared data store, that can be reused across many benchmark runs. Further, there needs to be an easy way to visualize these results as trend lines, and to perform further analyses on an ad hoc basis. I’ll show you how to do that with Elasticsearch for safe and accessible storage, Kibana for visualization and a Criterion-like framework for writing benchmarks.
Benchmarking is hard
Measuring the performance of isolated components through micro-benchmarks is pretty much a solved problem — at least in Haskell and Ocaml — thanks to the amazing Criterion library and subsequent imitations. However, isolated benchmarks are rarely useful. You rarely care about exactly how long it takes for a function to run without some context. You want to be able to compare benchmark results: before this commit, over time, etc. This leads to other problems like ensuring that all the benchmarks are run on the same hardware and how to store those benchmarks. Some solutions have emerged for particular use cases (see rust’s solution and GHC’s solution, to name a few) but it’s impractical to roll out a new solution for every single project.
The tools mentioned above allow the benchmarks to be compared and visualized. But there are off-the-shelf tools that enable just that: Elasticsearch, which allows you to store, search and analyze your data, and Kibana, an Elasticsearch plugin, that makes it possible to visualize just about anything.
We’ll use Hyperion to perform the benchmarks and generate the data. We can imagine that, in the future, it may be possible to do this using Criterion instead.
Setting up Elasticsearch
We’ll set up local instances of Elasticsearch and Kibana.
The easiest way is to spin up ready-made containers, for instance using the
docker-elk
project. It uses docker-compose to start some containers:
Elasticsearch on port 9200, and Kibana on port 5601
(it also starts a Logstash container but we won’t be using it). Here we go:
$ git clone [email protected]:deviantony/docker-elk.git
$ cd docker-elk
$ docker-compose up -d
$ curl localhost:9200
{
  "name" : "7pOsdaA",
  "cluster_name" : "docker-cluster",
  "cluster_uuid" : "e_CQlDgCQ1qIHob-n9h3fA",
  "version" : {
    "number" : "5.5.2",
    "build_hash" : "b2f0c09",
    "build_date" : "2017-08-14T12:33:14.154Z",
    "build_snapshot" : false,
    "lucene_version" : "6.6.0"
  },
  "tagline" : "You Know, for Search"
}
We’ll need to configure Elasticsearch. Time to get your JSON goggles, because we’ll use JSON as the lingua franca, and there’s going to be plenty of it from now on.
We’ll create an Elasticsearch index by crafting a JSON index
specification and uploading it to the Elasticsearch instance. An
index is similar to a database. The index requires a “type” (here
all-benchmarks), which is similar to a table (we won’t go into the details
but go have a look at the
documentation
if you’re interested):
{
  "settings": {
    "number_of_shards": 1
  },
  "mappings": {
    "all-benchmarks": {
      "dynamic": true,
      "properties": {
        "bench_name": {
          "type": "keyword"
        },
        "time_in_nanos": {
          "type": "float"
        },
        "timestamp": {
          "type": "date",
          "format": "epoch_second"
        }
      }
    }
  }
}
When using Elasticsearch it is much easier to work with flat JSON documents without nested fields. Here’s a JSON document that fits with the index above, which we find works well for benchmark data:
{
  "bench_name": "fibonacci",
  "timestamp": "1504081132",
  "time_in_nanos": 240
}
Let’s break down the index fields. The key properties specifies which fields
we want to be present when a new ES document is uploaded. In this case we’ll
have
bench_name: the benchmark name, as akeyword, which is a string field type that ES can index,time_in_nanos: the measured execution time for the given benchmark,timestamp: an ES date which will be used as the canonical timestamp (to clarify we specify the format, the number of seconds since the epoch).
dynamic: true: this tells ES that other fields might be present and that it
should try to index them as well. Let’s save the index definition to a file
index.json and upload it as index hyperion-test:
$ curl -X PUT 'http://localhost:9200/hyperion-test' --data @index.jsonElasticsearch is set up!
Generating the data
To upload benchmark timings, you’ll need them in JSON format. How you generate the data depends greatly on what kinds of systems you are going to benchmark and what programming language you are using. One possibility is to use the Criterion benchmark framework. But in this post, for simplicity, I’ll use Hyperion, an experimental lab to explore future Criterion features, because the JSON output produced by that tool is easier on Kibana.
hyperion is not a replacement for Criterion, rather it is a place for trying out new ideas. We wanted a lab where we could develop and experiment with new features, which might in turn be contributed to Criterion itself. Hyperion includes features like recording the benchmark input in the report and the ability to export raw data as a flat JSON structure (we’ll use this in a minute).
We’ll use Hyperion’s micro-benchmark example to generate the data:
benchmarks :: [Benchmark]
benchmarks =
    [ bench "id" (nf id ())
    , series [0,5..20] $ \n ->
        bgroup "pure-functions"
          [ bench "fact" (nf fact n)
          , bench "fib" (nf fib n)
          ]
    , series [1..4] $ \n ->
        series [1..n] $ \k ->
          bench "n choose k" $ nf (uncurry choose) (n, k)
    ]

main :: IO ()
main = defaultMain "hyperion-example-micro-benchmarks" benchmarks
If you’ve used Criterion before, the functions bench and
benchGroup will look familiar. series is a Hyperion function
that will run the benchmarks with different input while allowing the input to
be recorded in the report. Let’s see what this looks like:
$ stack exec hyperion-micro-benchmark-example -- --json -
{
  "metadata": {
    "location": null,
    "timestamp": "2017-08-30T08:36:14.282423Z"
  },
  "results": [
    ...
    {
      "alloc": null,
      "bench_name": "pure-functions:15/fib",
      "bench_params": [
        15
      ],
      "cycles": null,
      "garbage_collections": null,
      "measurements": null,
      "time_in_nanos": 4871.05956043956
    },
    ...
    ]
}
The --json - argument tells Hyperion to write a JSON report to
stdout. Hyperion generates a metadata section with general information, and
a results section containing the individual benchmark results. You’ll see
that some benchmarks results contain a field bench_params: this is the input
data given by series.
This format however is not ideal for working with Elasticsearch for several reasons:
- All the benchmark results are bundled within the same JSON object which means that they can’t be indexed independently by Elasticsearch.
- The metadata section is barely useful: the
locationfield does not provide any useful information and thetimestampfield was sourced from system date which means it depends on when the benchmark was run, not when the code was committed.
We’ll annotate the metadata with information gathered from git and we’ll make
the format ES-friendly:
$ alias git_unix_timestamp="git show -s --format=%ct HEAD"
$ alias git_commit_hash="git rev-parse HEAD"
$ stack exec hyperion-micro-benchmark-example -- \
    --arg timestamp:"$(git_unix_timestamp)" \
    --arg commit:"$(git_commit_hash)" \
    --flat -
We created two helpers for getting a unix timestamp and the latest commit’s
hash from git and used that to annotate the metadata with
Hyperion’s --arg key:val. Then with --flat - we tell
Hyperion to write a flat version of the JSON benchmark report to
stdout, which is effectively a JSON array where each element contains the
information about a particular benchmark as well as a copy of the metadata:
[
  ...
  {
    "alloc": null,
    "bench_name": "pure-functions:15/fib",
    "commit": "91df3b9edc0945a1660e875e37f494e54b1419f5",
    "cycles": null,
    "garbage_collections": null,
    "location": null,
    "measurements": null,
    "time_in_nanos": 4998.988241758242,
    "timestamp": "1504081805",
    "x_1": 15
  },
  ...
Very good, let’s reuse that command and (with a little help from
jq and
xargs) feed each element to
Elasticsearch (in practice you’ll want to use Elasticsearch’s bulk
API
but let’s keep it simple for now):
$ stack exec hyperion-micro-benchmark-example -- \
    --arg timestamp:"$(git_unix_timestamp)" \
    --arg commit:"$(git_commit_hash)" \
    --flat - \
    | jq -cM '.[]' \
    | xargs -I '{}' -d '\n' \
    curl -X POST 'http://localhost:9200/hyperion-test/all-benchmarks' \
        -H 'Content-Type: application/json' \
        -d '{}'
Kibana’s Way
As mentioned earlier, we also span up a Kibana container. However if
try to access it now you’ll most likely get an error, since we haven’t
configured Kibana yet. We need to tell it what ES indices it should
gather the data from. Let’s tell Kibana to use any index that’s
prefixed with hyperion. We’ll first create an index
pattern,
then tell Kibana to use that index pattern as the default:
$ curl -X PUT 'http://localhost:9200/.kibana/index-pattern/hyperion*' \
    -H 'Content-Type: application/json' \
    -d '{"title": "all hyperion", "timeFieldName": "timestamp"}'
$ curl -X PUT 'http://localhost:9200/.kibana/config/5.5.2' \
    -H 'Content-Type: application/json' -d '{"defaultIndex": "all hyperion"}'
You should now be able to access Kibana by pointing your browser to http://localhost:5601. In the Discover landing page you should see a list of the benchmark data that we uploaded to Elasticsearch earlier (if you don’t see anything try to expand the time range by clicking the time picker on the top right corner). We’ll create our first visualization using that data by clicking the Visualize tab on the left menu, and then “Create a new visualization”, “Line”. Then click the index pattern that we created earlier (“hyperion*”). This should take you to a dashboard where you can describe the visualization. This is where the magic happens.
We’ll create a benchmark visualization for the Fibonacci function as
implemented in Hyperion’s micro-benchmark
example
at the commit we uploaded earlier (in my case 91df3b9...). First let’s set
the Kibana’s filter to only include the benchmark results we’re
interested in (for more information about the query language see the Lucene
query syntax
documentation):
commit:"91df3b9edc0945a1660e875e37f494e54b1419f5" AND bench_name:pure-functions*fib
Then let’s make sure that our benchmark data is in scope by clicking the time
picker at the top right corner and set the time range to “Last 6 months”
(anything will work as long as the timestamp of the specific commit you tagged
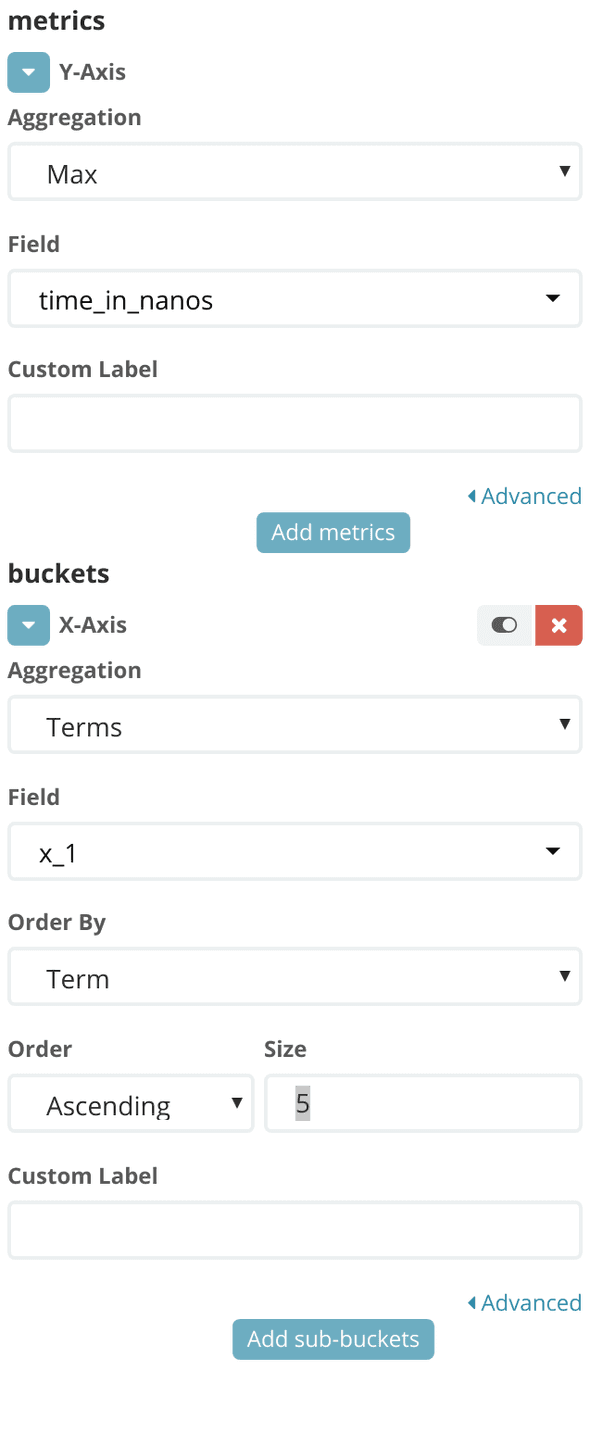
your data with falls into that range). We can fill the metrics and buckets
settings in the panel on the left hand side (see picture below).
Let’s break this down:
-
X-Axis Aggregation: By using Elasticsearch’s term aggregation we’re able to use one of the document’s field as values for the X axis. Here we use
x_1which is the parameter generated byseriesand used as an argument tofib. We set the Order to “Ascending” and Order By to “Term”. If you nested severalseriesyou could pickx_2,x_3, … as the X axis, allowing you to easily compare the effect of various parameters. Or you could use thetimestampparameter to see the evolution of your system’s performance over time. Let’s stick tox_1for now. -
Y-Axis Aggregation: here we picked “Max” as the aggregation value. What this means is that when several values are available for a specific X value Kibana will only display the maximum value. If you’ve set the filter to use only the values of
pure-functions*fibyou should only get a single value anyway, but this can come in handy if you have more than one value and you want to perform custom regressions (see Hyperion’s--rawargument).
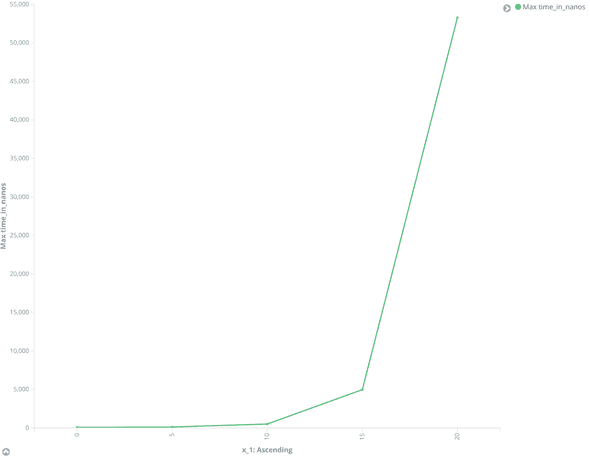
You should get a plot similar to the following image:
And there it is!
Summary
This was a very simple example of what’s possible to achieve with Elasticsearch and Kibana. We’ve setup a bridge between our benchmarking code and Elasticsearch, to which we offload all the heavy lifting of the data analysis. We got great plots for free, thanks to Kibana. But we’ve only scratched the surface of what’s now possible. Here are a few things you could try out:
- Use Kibana’s split series to display several benchmarks alongside each other for better analysis,
- Use Hyperion’s
--rawmode (or similar from Criterion) with Elasticsearch’s various aggregators to get more insights into your benchmark data (like visualizing variance), - Display your per-commit benchmark data linearly by using
Hyperion’s extensible metadata mechanism with
--arg commit_number:"$(git rev-list --count HEAD)", - Setup a direct link to your commits on GitHub from
Kibana by using
Hyperion’s extensible metadata mechanism with
--arg commit_link:http://github.com/user/project/commit/"$(git rev-parse HEAD)", - Ensure your benchmarks are run (and uploaded to Elasticsearch) on your CI.
Enjoy!
About the author
If you enjoyed this article, you might be interested in joining the Tweag team.


